Frequently Asked Question
How should I use the autotrigger ?
Last Updated 11 years ago
Warning ! It is worth noting that this will only work for on the alibava autotrigger daughter boards.
This procedure is described in the Alibava user's manual, available at www.alibavasystems.com -> Downloads -> Alibava Classic
The Beetle chip has individual-channel fast comparators that can be activated. The comparators on the Beetle chip have a non negligible spread and therefore the chip provides mechanisms to aling the thresholds of all the channels for a given working global threshold. This is a quite involved procedure but alibava-gui provides an authomatic, yet slightly slow, procedure to do it.
The procedure is based on counting the number of triggers for a given configuration of the threshold and the channel corrections. This usually produces the socalled s- curves which, when properly normalized, yield a 1 when all the events produce a trigger, 0.5 when the threshold is equivalent to the mean of the input charge distribution and 0 when no event produces a trigger. This is done with the Beetle calibration circuit. This system procudes alternate polarities for each channel, always with he same absolute value of the input charge. So when one programs a given number of events, only have of them will have the proper polarity. This is taken into account when normalizing so that when the threshold is so low that we trigger on the noise the value of the s-curve is 2, instead of 1, since we also trigger in the events with the opposite polarity. This defines a characteristic red band in the histograms produced. There is another "effect" that has to do with the case in which we trigger also on the undershoot of the pulse in the events with the oposite polarity. This explains why the
s-curves have like two ending points.
The procedure is as follows:
1. Connect the output of the autotrigger in the DB to the TriggerPulse input in the MB.
2. Configure the trigger (see the Section called External Trigger configuration ) to trigger on TriggerPulse and set the negative and positive values of the threshold to -500 and 50 respectively. Other values may work as well: check with your osciloscope.
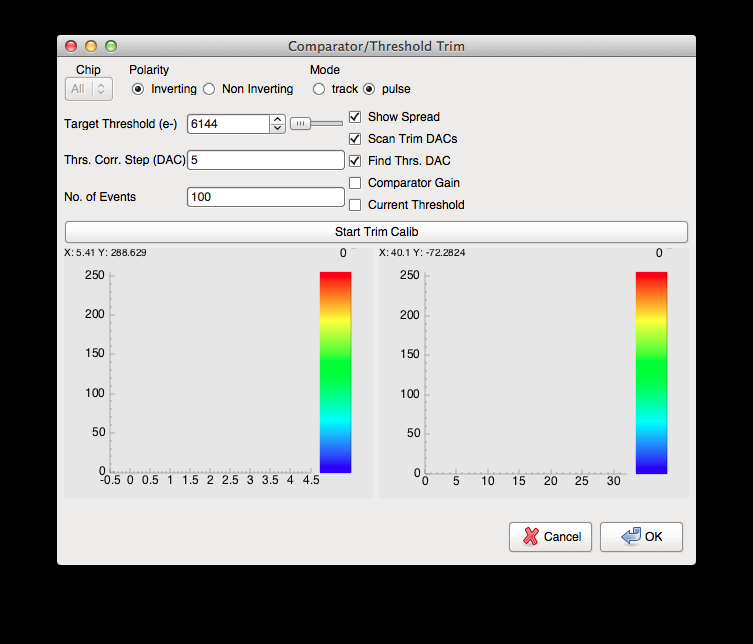
3. Click on the Calibration settings button or item in the menu and there click on the button with label Calib. Beetle Comparator (see the Section called Calibration run). A dialog window like the one shown in the figure will pop up.
4. Choose the target threshold (in units ofelectron charge: 1fC or 6250 e- are aprox. 22.5 KeV). Select Polarity (inverting for p-on-n sensors, non-iverting for n-on-p sensors), Mode Pulse (see the Beetle documentaion to understand these parameters). And click on the Start button.
5. When the analysis are over, click OK if you want to save the settings, or Cancel otherwise.
6. Save the settings in a configuration file by clicking on the Save As.. item in the File menu.
There is, on the right, a series of check buttons that will perform a specific task.
1. Show spread: This will make a scan of the threshold DAC values for an input calibration charge equivalent to the desired thresholds. The plot shows if the thresholds are aligned or not as shown the figure below. There, one can clearly see the all the channels will have the thresholds alinged to that particular target.
 BEFORE
  AFTER
AFTER
2. Scan Trim DACs: This will make a scan of the threshold correction DAC for each channel and make a linear fit of the main DAC resulting as a function of the correction. This will be used to find the final threshold DAC with the smallest spread among the channels.
3. Find Threshold DACs: This has to be done together with the previous. It will find the optimal threshold DAC that minimizes the threshold spread.
4. Comparator Gain: This will scan the threshold DAC for different input pulses so that one can see the characteristics curve of each channel’s comparator.
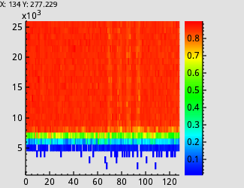
5. Current threshold: This can be used to check what is the level of alignment for the current settings. The plot produced is as shown below. It makes a charge scan for each channel so that we can see where the threshold is set for each of them. In the figure it is about 6000 e-.
Select the desired analysis and click the start button. You can click again the button to stop at any time. Then click cancel if you do not want to keep the settings or OK if you want to keep them.
This procedure is described in the Alibava user's manual, available at www.alibavasystems.com -> Downloads -> Alibava Classic
The Beetle chip has individual-channel fast comparators that can be activated. The comparators on the Beetle chip have a non negligible spread and therefore the chip provides mechanisms to aling the thresholds of all the channels for a given working global threshold. This is a quite involved procedure but alibava-gui provides an authomatic, yet slightly slow, procedure to do it.
The procedure is based on counting the number of triggers for a given configuration of the threshold and the channel corrections. This usually produces the socalled s- curves which, when properly normalized, yield a 1 when all the events produce a trigger, 0.5 when the threshold is equivalent to the mean of the input charge distribution and 0 when no event produces a trigger. This is done with the Beetle calibration circuit. This system procudes alternate polarities for each channel, always with he same absolute value of the input charge. So when one programs a given number of events, only have of them will have the proper polarity. This is taken into account when normalizing so that when the threshold is so low that we trigger on the noise the value of the s-curve is 2, instead of 1, since we also trigger in the events with the opposite polarity. This defines a characteristic red band in the histograms produced. There is another "effect" that has to do with the case in which we trigger also on the undershoot of the pulse in the events with the oposite polarity. This explains why the
s-curves have like two ending points.
The procedure is as follows:
1. Connect the output of the autotrigger in the DB to the TriggerPulse input in the MB.
2. Configure the trigger (see the Section called External Trigger configuration ) to trigger on TriggerPulse and set the negative and positive values of the threshold to -500 and 50 respectively. Other values may work as well: check with your osciloscope.
3. Click on the Calibration settings button or item in the menu and there click on the button with label Calib. Beetle Comparator (see the Section called Calibration run). A dialog window like the one shown in the figure will pop up.
4. Choose the target threshold (in units ofelectron charge: 1fC or 6250 e- are aprox. 22.5 KeV). Select Polarity (inverting for p-on-n sensors, non-iverting for n-on-p sensors), Mode Pulse (see the Beetle documentaion to understand these parameters). And click on the Start button.
5. When the analysis are over, click OK if you want to save the settings, or Cancel otherwise.
6. Save the settings in a configuration file by clicking on the Save As.. item in the File menu.
There is, on the right, a series of check buttons that will perform a specific task.
1. Show spread: This will make a scan of the threshold DAC values for an input calibration charge equivalent to the desired thresholds. The plot shows if the thresholds are aligned or not as shown the figure below. There, one can clearly see the all the channels will have the thresholds alinged to that particular target.
2. Scan Trim DACs: This will make a scan of the threshold correction DAC for each channel and make a linear fit of the main DAC resulting as a function of the correction. This will be used to find the final threshold DAC with the smallest spread among the channels.
3. Find Threshold DACs: This has to be done together with the previous. It will find the optimal threshold DAC that minimizes the threshold spread.
4. Comparator Gain: This will scan the threshold DAC for different input pulses so that one can see the characteristics curve of each channel’s comparator.
5. Current threshold: This can be used to check what is the level of alignment for the current settings. The plot produced is as shown below. It makes a charge scan for each channel so that we can see where the threshold is set for each of them. In the figure it is about 6000 e-.
Select the desired analysis and click the start button. You can click again the button to stop at any time. Then click cancel if you do not want to keep the settings or OK if you want to keep them.